LAB 10A - STAR FILE
Concepts
This assignment exercises your new skills for working with file streams.
Instructions
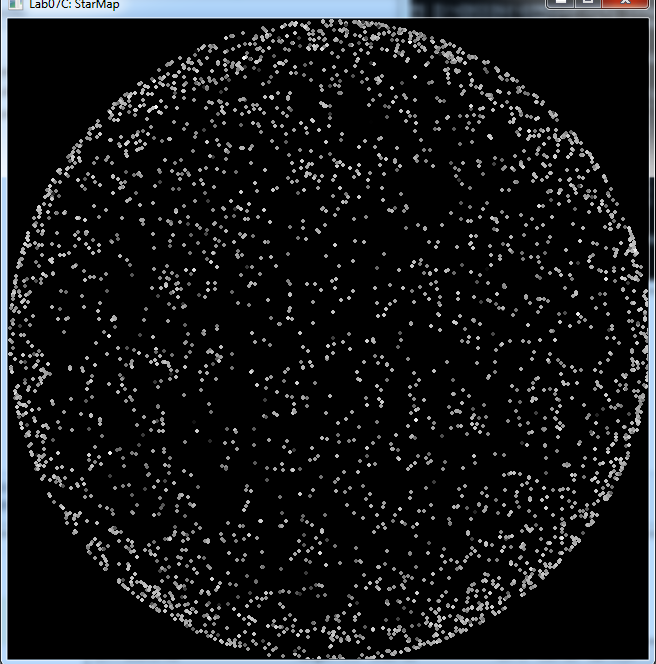
Your task for this lab is to read a data file containing star information, modify the information read, and write the new data to an output file. On Wednesday, you will read in the new data file you created and draw a star map similar to the one shown here (ahhhh - cool!) This lab will be due with Homework 10.
Data File
To begin, create an empty project (called Lab10A), and place the stars.txt file in the appropriate directory. As previously mentioned, an input file needs to be placed at the project level. You should see both your input file AND a .vcxproj file in the same directory.
Basically your job is to read the data that is within this file, make modifications to the data in order to draw the data, and then write the modified data to a new file called ModifiedStars.txt (for use on Wednesday). Each line of the data file contains information of one star, with each field separated by a tab. The meaning of each field (column) is described below. Note that data files often contain more information than is needed for a given purpose and that data files may contain outlying values that are also not needed for a given purpose. We suggest you take a look at the stars.txt as you read the following details about your input file.
- The first three fields are the x, y, and z coordinates for the star. You will need to store the x and y coordinates (after modification, see below), but will not need the z coordinate. Thus, in your output file, only write the modified x and y coordinates. The coordinate system is described in more detail below.
- The fourth field is the brightness of each star. We only want to plot stars with a brightness between 0.0 and 8.0, so only write those stars to the output file.
- The fifth and sixth fields are the Henry Draper and Harvard Revised numbers for the star. These are numbers used in different star catalog systems, so they can be ignored for this assignment. Thus, you do not want to write these numbers to the output file.
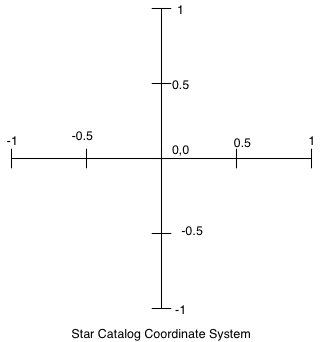
Coordinates
Each axis in the star coordinate system goes from -1.0 to +1.0 and the center point is (0, 0). Thus, the x and y coordinate values for each star will all be numbers in the range -1.0 to +1.0.
The coordinate system used in our graphics library (SFML) has position (0, 0) in the upper-left corner of the picture, and the maximum x and y values are the width and height of the picture, in pixels.
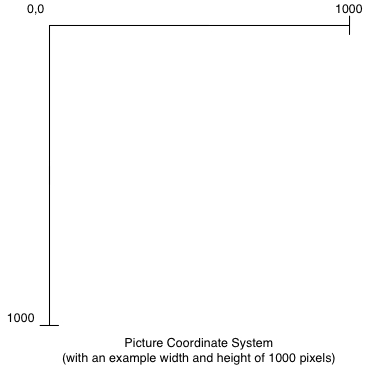
Thus, to determine the location of each star to draw in our graphics library, you need to convert from the -1.0 to +1.0 range of the star coordinate system to the (0, 0) to (WIDTH, HEIGHT) range of the graphics library coordinate system. Declare WIDTH and HEIGHT as constants in your program, with both values set to 640 (which are defined for your screen size).
More specifically, if xStar is a double variable holding a star's x-coordinate in the range -1.0 to +1.0, to convert it to an integer pixel value in the range 0 to WIDTH, you would use the following:
Similarly, if yStar is a double variable holding a star's y-coordinate in the range -1.0 to +1.0, to convert it to an integer pixel value in the range 0 to HEIGHT, you would use the following:
Note the minus sign on the yPixel equation. We encourage you to plug a few coordinates into these equations, e.g., (-0.5,0.5) and (-0.5,-0.5), to ensure the equations are correct.
Putting It All Together
Even though we are only using the x, y, and brightness values, you will need to read all six values on each line of the data file. Make sure you read each of these into an appropriate type variable.
Each line in the output file has the following fields:
- the first two fields should be the modified (x,y) coordinates for the star;
- the third field should be the brightness;
- and all fields should be tab separated ('\t').